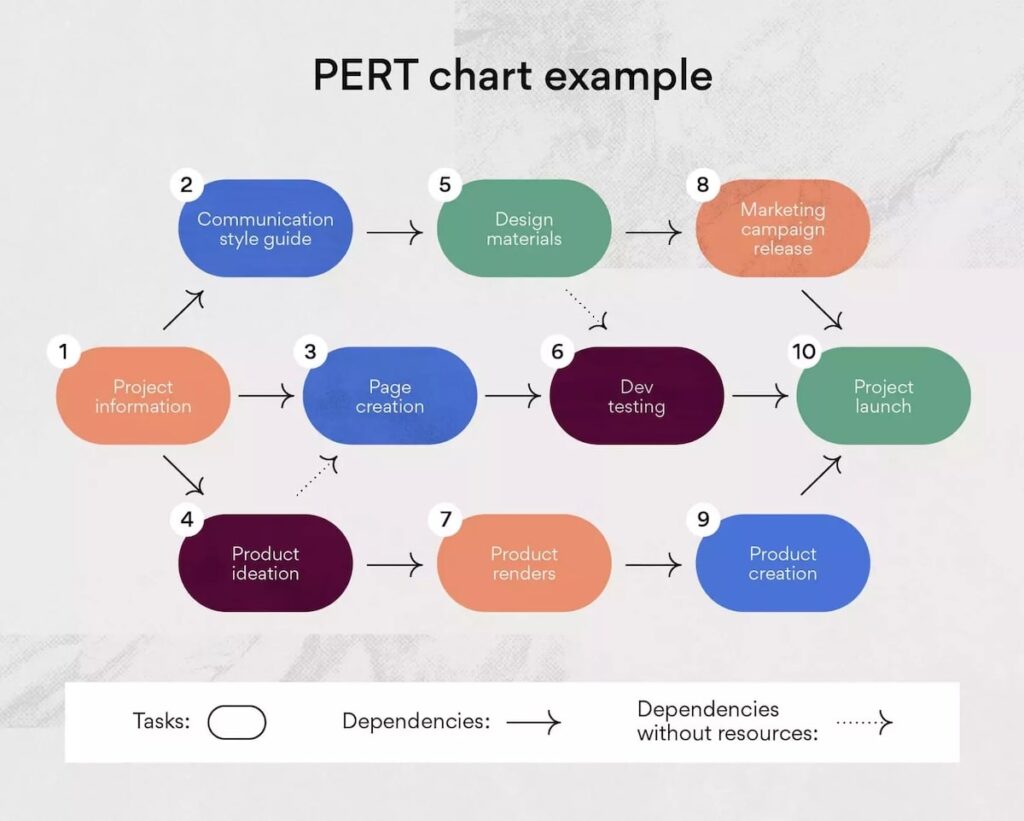
PERT chart: differences from other project management tools
There are several tools that can be used to efficiently organize the process of working on a project, correctly identify tasks, and plan deadlines for their completion. One of the most popular techniques for a manager is the PERT chart. It makes it possible to visualize each stage of work on the project. The visibility of tasks greatly simplifies the process for all team members.
PERT is a technique for analyzing projects. Its name is an acronym of Program, Evaluation, Review, and Technique. Based on an evaluation of the project and its complexity, a chart is created that reflects the relationship between tasks and the timing of their completion. Keep in mind, however, that the PERT planning chart has its own peculiarities and is not appropriate for every team.
Differences between PERT and similar tools:
The PERT chart, like the CPM critical path methodology, refers to tools for visualizing all items and determining their dependencies. The charts are similar in appearance and belong to the same type of network charts. However, they differ in the number of characteristics they analyze. For example, the critical path chart uses only one parameter to estimate the time to complete tasks, while PERT uses three. The latter feature allows you to set multiple probabilities of project time.
The Gantt Chart gives you the ability to visualize the entire scope of work. It is a ribbon tool and is easy to use. However, in this case, the chart does not give you the ability to drill down into each item as in PERT. The priority chart takes more emphasis.While a Gantt chart is great for keeping the team informed about the progress of a project, a PERT chart is useful for estimating the timing of assigned tasks.

To create a logical PERT chart, you must first create a complete list of tasks with their detailed descriptions. Next, determine the dependencies between them.
The next step is to create a table with 6 columns:
- task name;
- the task that was completed before the current one was implemented;
- an optimistic forecast of the execution time;
- average time to implement the task;
- worst-case scenario of task implementation;
- estimated period of project delivery.
It is important to estimate the durations for the three options because they will be used later to determine the project durations. To do this, multiply the average duration by 4 and add the optimistic and worst case durations. To be noted, the result is then divided by 6. For ease of use, there are chart templates where you only need to insert the data.
PERT chart allows you to show the conditions of execution with greater accuracy, identify critical points that can increase the time of the project. With this tool, you can clearly see which tasks you can move to speed up the process and which slow it down. It’s necessary to understand that the entire result depends on the accuracy of the calculation of the parameters, otherwise the use of the PERT chart will be meaningless.


